View Menu |

|

|
|
View Menu |
|
|
View Menu |
|
|
|
View Menu |
|
|
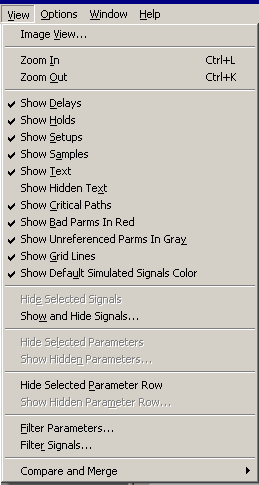
•Image View: Opens the Image View Capture dialog to create Views of the diagram for fast scrolling and printing of different sections. (Section 7.1: Views in DataSheet Pro). |
•Zoom In and Zoom Out menus are one way to change the level of detail in the diagram window. See Zoom Buttons. •The Show object menus, if checked, show those kinds of objects. •Show Hidden Text allows attachments to signals like text objects and grid lines to continue to be displayed even when their parent signal is hidden (Chapter 1.4: Display Settings for Signals). •Show Critical Paths: If checked, delay objects are color coded to indicate which edges of the delayed transition are set by the delay. •Show Bad Parms in Red: If checked, setups and holds whose times have been exceeded will be drawn in red. •Show Unreferenced Parms in Gray: If checked, the background of rows in the Parameter window is gray for parameters which are not used in any other parameter formulas. •Show Default Simulated Signals Color: If checked, simulated signals are drawn in purple. |
|
•The Hide Selected object and Show Hidden object selectively hide and show those objects. "Parameters" are instances in the diagram window, and "Parameter rows" are the data rows in the parameter window. •The Filter object menus allow hiding and showing to be based on a filter pattern. •Compare and Merge: Opens a sub-menu that allows you to compare all signals or to search for a specific difference between the signals. See Chapter 9: Waveform Comparison. |