7.4 OLE- Object Linking and Embedding |

|

|
|
7.4 OLE- Object Linking and Embedding |
|
|
7.4 OLE- Object Linking and Embedding |
|
|
|
7.4 OLE- Object Linking and Embedding |
|
|
The OLE option allows images to be embeded into word processors and other applications so that the image and the timing diagram file are linked. Double clicking on the image will launch the timing diagram editor for editing. DataSheet Pro includes the OLE option, and it is also available as an add on to WaveFormer Pro, Timing Diagrammer Pro, VeriLogger, BugHunter and TestBencher Pro. This is a Windows Only Feature.
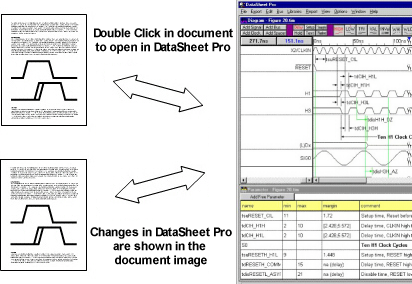
OLE provides a convenient way to manage timing diagrams which are included in many of your documents, such as word processor files, spreadsheets, and presentation graphics. Then, when you make changes to your timing diagrams, they are automatically updated in the linked or embedded third-party files. This feature greatly simplifies documentation by allowing changes to timing diagrams to be made in only one place.
Embedding allows you to save timing diagrams directly into a 3rd party file. If you have a timing diagram you want to show in a report, for instance, you may embed a copy of your timing diagram file directly into your word processing file. Later, you can open the word processing file and edit the embedded image by double-clicking on it, which re-launches WaveFormer for further editing. As you edit the timing diagram, changes are automatically shown in the embedded image in your report. You can embed as many diagrams as you want in a given document.
With Linking, a single timing diagram file can be connected to many documents which need to include it. Unlike OLE embedding, the timing diagram is stored into a separate file and the 3rd party file contains a link to the timing diagram file. For instance, if you’re working on a report and a presentation and want to show the same timing diagram in both documents, you simply link each document to the desired timing diagram file. This way, any changes you make later in the timing diagram file will be updated automatically in both your report and presentation. You may link your timing diagram to as many other documents as you like, and you can include the same link multiple times in a single document.
When OLE option is enabled it turns the timing diagram editor into an OLE Server. This means that timing diagrams can be linked to or embedded within other applications. These applications, in turn, are known as OLE Clients since they make use of the server’s features. Many of the more popular programs, like MS Word and FrameMaker, work as OLE clients. OLE is a Windows-only feature, and is not supported by UNIX X-Windows systems.
To embed or link a timing diagram into a 3rd party application:
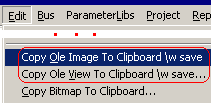
•Inside DataSheet Pro, choose one of the Edit > Copy OLE menus to copy the visible timing diagram to the clipboard. Note: If the diagram file has not been previously saved to a valid filename, the Save As dialog will appear so that you can assign it a filename. |
|
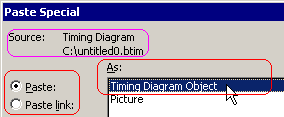
•In your third-party application (like Word) select Edit > Paste Special to open the pasting dialog. •The following image is from the Microsoft Word's Paste Special dialog but most paste dialogs will have similar controls: |
•Check to see that the source is your timing diagram. •Select the Paste radio button (for embedding) or Paste link (for linking). •Select Timing Diagram Object from the As list. |
|
•Click OK to close the dialog and you should see the embedded timing diagram within your application. |
The Print dialog controls which objects get rendered for OLE objects:
The print dialog controls which objects in the timing diagram get rendered, the print time range, and whether a border box or a time line is included or not. See Section 7.5: Printing for more information on this dialog.
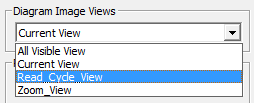
•Select the File > Print Diagram menu to open the Print dialog. •Select the Diagram Image View that you want the settings to apply to (See Section 7.1 Views in DataSheet Pro). |
|
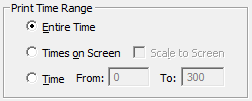
•The Print Time Range section controls the range of the timing diagram that gets put into the OLE image. Note that this is not necessarily the time range displayed in the diagram window for a particular view. If you want the OLE image to match the time range shown in the diagram window, you need to check the "Times On Screen" radio button. |
|
•The paper width minus the Margin width setting determines the physical width of the image. The paper width is ~8.5 inches, so if you use a margin of 1.5 inches, you'll get an OLE image with a width of: 8.5 - 2*1.5 = 5.5 inches. •The margin height has no effect on the OLE image's height, this is set by the number of signals displayed in the view and the height of each signal (which is a function of the signal label font size). The controls for waveform height or the font size for signal labels are located in a dialog opened by the Options > Drawing Preferences menu. |