Ultra-Quick Online Tutorial |

|

|
|
Ultra-Quick Online Tutorial |

|

|
This Ultra Quick tutorial shows you how to draw a simple timing diagram and simulate a simple Boolean equation. More comprehensive tutorials are available from the Help > Tutorials menu.

1) Open a new timing diagram file
•Choose File > New Timing Diagram menu to open an new timing diagram. |
|
2) Add a clock with a period of 100 ns
•Press the Add Clock button to open the Edit Clock Parameters dialog. |
|
•The default period is already set to 100 ns, so the clock is created. However, notice that the clock can also be defined using a reference clock or a period formula. Chapter 2: Clocks covers these options in more detail. •Press Ok to close the dialog. |
|
3) Add SIG0 and draw its waveform
•Click the Add Signal button to add a blank signal with the default name of SIG0. |
|
•Look at the waveform buttons. The red one controls the type of waveform that is drawn next. After that the buttons will toggle to the state with the red T on top. Pressing the buttons will set a different draw and next state. This shows a toggling between high and low states. |
|
•Put the mouse cursor on the same row as the signal SIG0 at about 100ns and left click to draw a high waveform from 0ns to the mouse cursor position. Move the cursor to 150ns and click the mouse button to draw a low segment from the end of the signal to the cursor point. Draw some more segments on SIG0 while watching the waveform buttons. Chapter 1: Signals and Waveforms covers all of the signal drawing and display features. |

4) Add signal SIG1 and simulate it as the a Boolean equation of SIG0 and CLK0
This step requires at least WaveFormer Pro. If you are using Timing Diagrammer skip to the next step.
•Click the Add Signal button to add a signal, then double click on the SIG1 name to open the Signal Properties dialog. This dialog allows the name and other signal properties to be changed. •Enter the equation SIG0 and CLK0 into the Boolean Equation edit box. The signal names are case sensitive. •Select the Simulate radio button. This setting automatically re-simulates SIG1 whenever an input waveform is changed. •Click OK to close the dialog. |
|
•Experiment with the simulated signal by dragging and dropping an edge on SIG0. Each time the edge is moved, a simulation is performed and SIG1 redraws itself. (The clock edges cannot be moved with the mouse). |
|
•Add a 10ns delay to the SIG1 equation by changing the equation to (SIG0 and CLK0) delay 10. Verify that SIG1 is correctly drawn. Chapter 4: Simulated Signals covers the details on simulation. |
5) Add a delay parameter named D0.
•Press the Delay button so that right clicks will add delays. |
|
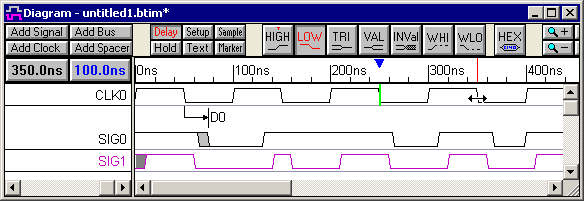
•Left click on the falling edge of CLKO at 50ns to select the edge, then Right click on SIG0's first transition (at about 100ns). This draws a delay parameter from the selected clock edge to the SIG0 edge. |
|
•Double-click on D0 to open the Delay Properties dialog. •Enter 15 into the Min box, and 25 into the Max box, then press OK to close the dialog. •Notice that the SIG0 transition has moved so that it starts 15ns from the clock edge and the gray uncertainty region is 10ns wide (25-15=10). Chapter 5: Delay, Setup, & Hold Parameters covers parameters in more detail. |
|
Summary
Congratulations you have completed the Ultra-Quick Tutorial. The Tutorial covered starting an new timing diagram, generating a clock, drawing a signal, simulating a signal, and adding a delay parameter. In general, the following mouse functions are used in the program:
•Left mouse click to draw waveforms and move things around. |
•Right mouse click to add the object highlighted in second group of buttons on button bar (like adding delays or text). |
|
•Double-click on objects to edit them (like signal names, text objects, parameters, edges, clocks). |
Please take the time to look through the manual to get an idea of the timing analysis and display features that are not covered in the Ultra-Quick Tutorial. Also the Help > Tutorials menu has much longer and in depth tutorials.