6.5 Marker Lines |

|

|
|
6.5 Marker Lines |
|
|
6.5 Marker Lines |
|
|
|
6.5 Marker Lines |
|
|
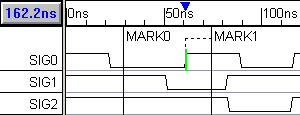
Markers are vertical lines that display their placement time in the timing diagram. Once a marker is added to the timing diagram, its behavior can be altered so that it compresses time, mark the end of the diagram, create a loop in the diagram, or call an HDL code segments.
To add a time marker:
•Press the Marker button so that right clicks will add marker lines to the diagram. |
|
•To attach a marker to a time, make sure no edges are selected, then right click on a waveform to add a marker. •To attach a marker to an edge, select the control edge, then right click. If the edge is moved, the the marker will stay a fixed distance from the edge |
|
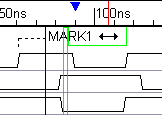
•To move a time marker, drag and drop the time marker line or name. |
|
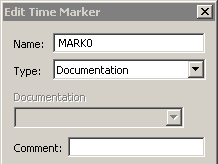
•To edit a marker, double click on the marker to open the Edit Time Marker dialog. •The name field for markers can be blank, so that by default the maker only displays its line. This is the only object besides spacer signals that can be nameless. |
|
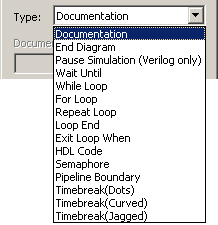
•The Type determines the behavior of the marker. •Documentation is a marker with a solid line that can also display time. •End Diagram stops stimulus generation at that point. •Pause Simulation, Wait Until, Exit Loop When, HDL Code, Semaphore, and Pipeline Boundary are TestBencher Pro and Reactive Test Bench features, but in the timing diagram editors they behave like Documentation markers. See the Marker Chapters in those manuals. |
|
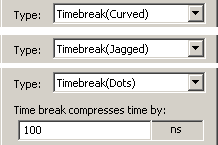
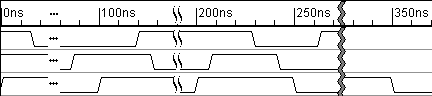
Time Compression Markers:
•Choose one of the Timebreak types to make a dotted, curved, or jagged line. •To compress time to the right of the marker, ender a time into the time break compress time by box. The compressed time still exists, but it does not display on the screen. |
|
| Dotted timebreak | Curved timebreak Jagged timebreak |
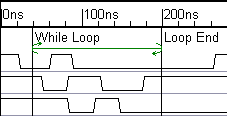
Loop Markers:
Loop Markers are pairs of markers that draw a line between themselves to show that part of the timing diagram should be repeated. If you are adding loops for test bench generation, please read the marker chapters in the TestBencher Pro or Reactive Test Bench Generation Manual. This section is only about making pretty looking markers.
•Add two markers to the diagram. •For the left most marker choose one of the loop start types of While Loop, For Loop, or Repeat Loop. •For the right most marker choose the Loop End type. |
|
•To make this picture we also set the Display Label to Type so that the markers would show their types. |
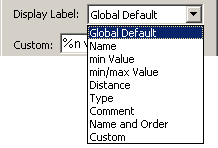
Display Name or any other property:
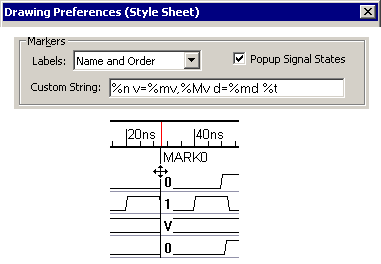
•Markers can display any of their properties listed in the Display Label box. The global default is set in the Options > Drawing Preferences menu. •The Custom label displays the string in the Custom box with the control codes replace by values. For an example of customs display strings, see Displaying Different Information for parameters in Section 5.3: Display Settings for Parameters. •The Type label for documentation markers is Blank so that you can just have a line and no other label. |
name = %n min value = %mv max value = %Mv distance = %md type = %t |
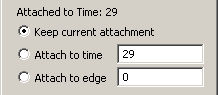
Change the Attachment of the Marker:
•The top of the box lists either the time or the signal and time of the current attachment. •Choose Attach to time and type in the new time. The display label for these types of markers will float at the top of the screen so as you scroll vertically through the diagram you can still see the marker display label. •Choose Attach to edge AND close the dialog. The editor will be in a continuous selection mode with a green edge highlight moving to different edges. Click on the new edge to set the attachment. Note the box to the right is the distance of the marker to the edge. |
|
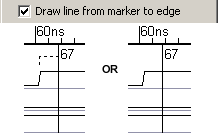
Edge lines for Markers:
•If the marker is attached to an edge, the Draw line from marker to edge box controls whether the attach to edge dotted line will be displayed |
|
Snap Ends to Marker
•Check the Signal ends snap to marker box and close the dialog. Now drag-and-drop the marker and notice that the ends of all the drawn signals snap to the new position of the marker. See Section 1.2: Drawing Waveforms for an extend example under the "Making Waveforms end at a common time". |
|
Display Label Position
•The Marker Label can be dragged and dropped so that it appears between two signals. Once this is done you can check the Auto-Adjust Display Label Position to return label placement control to the editor. |
|
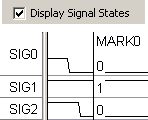
Display Signal States with the Marker
•Markers can permanently display the signal state values if the Display Signal States box is checked in the Marker Properties dialog. Otherwise the signal states are just shown when the mouse hovers over the marker line. |
|
Global Settings for Markers
•Select the Options > Drawing Preferences menu to open the Drawing Preferences dialog and look at the Markers section. •Popup Signal States controls whether markers show their states when the mouse sweeps over them. •Labels and Custom String are the default settings for the same controls in the Marker Properties dialog. |
|