2.3 Watching Signal and Component Waveforms |

|

|
|
2.3 Watching Signal and Component Waveforms |

|

|
After compiling a project, use the Project window to pick signals to be watched and placed in the Stimulus and Results diagram. To maximize simulation speed, simulators do not automatically store signal transition times unless a signal is specifically tagged as one to watch. Chapter 3: Waveforms and Test Bench Generation covers all the the intricacies of managing multiple Stimulus and Results diagrams.
Watch anything under Simulated Model: signals, ports, variables, or components
•Expand the Simulated Model folder until you locate something that you would like to watch. •Right-click on the node and choose one of the Watch menus, which will vary according to what type of object is selected. |
|
•After setting the watch, the signal name will appear in the Stimulus and Results diagram. The waveform data will be displayed during the next simulation run. If any signal is selected when you add the watch signal, the watch signal will be added after the last selected signal. •To remove a watched signal, just delete it from the Stimulus and Results diagram. |
|
•To temporarily stop watching a signal, double click on the signal name to open the Signal Properties dialog and change the signal type from watch to drive or compare. Generally it's best to make it a compare signal. |
|
•If a signal is currently being watched, watching the signal again will scroll the Stimulus and Results diagram to display the signal. •You can also view bit-slices of a watched signal by changing the MSB and LSB of the original signal or on a copy of the signal. See Section 3.4: Bit-Slicing a Watched Signal for a description of this technique. |
Top-level Models are automatically watched:
After you build the project, the signals or the ports in the top-level component are automatically added to the Diagram window. If the top-level component does not have port signals, the internal signals of the component are viewed. If the top-level component has port signals, the output ports are viewed as purple signals and input ports are viewed as black signals. You can edit the black input signals to provide stimulus to the top-level component. The waveform drawing functions are covered in Section 3.2 Drawing Waveforms for Stimulus Generation.
Global Settings for watch signals:
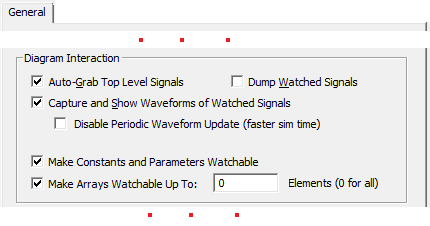
•Press the Project Simulation Properties button or choose the Project > Project Simulation Properties menu to open the dialog. |
|

•Auto-Grab Top Level Signals tells BugHunter to grab the signals in the top-level components and add them to the Stimulus and Results Diagram as default watch signals whenever a build is performed. •Capture and Show Waveforms of Watched Signals causes watched signals to display their waveform data in the Stimulus and Results Diagram. Normally this is unchecked if the Dumped Watch Signals is checked. •Dump Watched Signals will cause the watched signal data to be written to a Verilog Change Dump file (VCD file). This is normally unchecked because the Stimulus and Results Diagram captures waveform data in the BTIM format which is a much faster and more compressed format than VCD. |