11.2 Launching the Schematic window |

|

|
|
11.2 Launching the Schematic window |

|

|
The right click menus in the BugHunter Project tree allow you to display selected signals and component instances on a GOF schematic window. Once you have a partial schematic displayed, it is easy to quickly trace a gate's fan-in and fan-out so that you can determine how the gate is connected in the design. Tracing the fanout can be done using the middle mouse button.
It's important to note that GOF can only show schematics for gate-level designs (e.g. post-synthesis), not RTL-level designs.
To perform the steps below for the first time, we recommend you open the example gate-level design project file C:\SynaptiCAD\Examples\VeriLogger\GateLevelTimingSimulation\ripplecounter.hpj using the Project > Open Project menu option.
Build the Design and use the Context Menu to Launch the Schematic:
•Press the Build button to compile the project files, and build the Simulated Models hierarchical tree (see Section 2.2: Build and Simulate). |
|
•Navigate through the Simulated Models tree in the BugHunter Project window until you find a component or signal that you want to view on a schematic. •Right click on the node of the signal or component and choose Show object in Schematic menu. This will launch GOF and may take a little time because GOF will be parsing your entire design if this is the first schematic you have opened. |
|
Viewing the Schematic:
•GOF will launch a Viewer window and a schematic design with your design. •Each time you choose the Show object in Schematic menu in BugHunter, a new schematic will be opened but the same GOF Viewer will be there so the design does not have to be re-parsed. |
|
•To expand a schematic, press the middle mouse button down on a pin of a part and drag to display the objects that are attached to that pin. |
|
•GOF schematic windows have many functions for adding to the schematic, auto place and routing, and printing of the design. These features are covered in the GOF Help in Chapter 3: GofTrace - schematic viewer. |
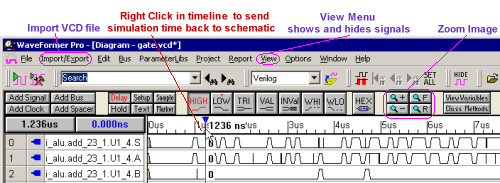
•GOF can also display back-annotated waveform information from BugHunter timing diagrams on schematic windows to help trace back to what caused a bug in a simulation. See Chapter 6: Waveform Viewer Support in the GOF Help for more details on how to debug using a combination of GOF schematics and the waveform windows in BugHunter. |
|
