2.6 Find Drivers |

|

|
|
2.6 Find Drivers |

|

|
When debugging a simulation, one of the most important questions to answer typically is why a signal is behaving unexpectedly. BugHunter provides a Show Drivers window for exploring the cause-effect relationships between signals. The drivers for a net can be found by using a context menu in the Project Tree.
Locate the Net in the Project Tree:
•Step into a simulation. The simulation must be running in order to view driver information for signals. |
•Find the Net in the Project tree. •If you have located it in the source code, then you can select it the signals and right click and choose the Find in Project from the context menu. |
|
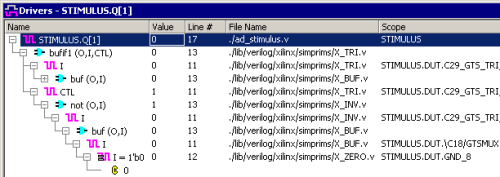
•In the Project tree, right click on the wire and choose Show All Drivers from the context menu. This will open a Drivers window to show the drivers and the signals connected to the drivers. |
|
•Use the + icons to drill into the drir information. •The color and type of icon shows information about the drivers and signals: Purple is a net, Green is a register, Blue is a primitive gate, Purple with Equal mark is a continuous assignment statement, and C is a constant value. |

•As shown in the above picture, if you expand the sub-tree of a driver, you can see the input signals to the driver and their current values. By descending thru the tree, you can trace signal paths in your design. •Double click on a driver name or signal to view the source code for a particular driver or signal. This will also change the simulator's current interactive scope to the instance containing this driver to provide more accurate display of tooltip information in the source editor window. •Double click in the value column to edit the value for that driver. •Double click in the scope column to view the source code for the scope instance. |