|
|||||||||||||||||||||||||||||||||||||||||||||||||||||||||||||||||||||||||||||||||||||||||||||||||||||
|
|
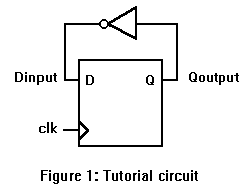
Basic Drawing and Timing Analysis (Tutorial 1)This tutorial demonstrates the basic timing diagram editor features of WaveFormer Pro, Timing Diagrammer Pro, VeriLogger Pro and TestBencher Pro. It teaches you how to draw timing diagrams using delays, setups, clocks and part libraries and how to use timing diagrams to help detect timing errors in digital designs. It also covers the waveform editing features, measurement and quick access buttons. You will draw the timing diagram for the circuit shown in Figure 1. This circuit divides the clock frequency in half. Both the flip-flop and the inverter have propagation times that delay the arrival of the Dinput signal. If the Dinput is delayed too long it will violate the data-to-clock setup time. This increases the risk of the flip-flop failing to clock in the data and may lead to the flip-flop entering a metastable state.
Circuit Parameters:
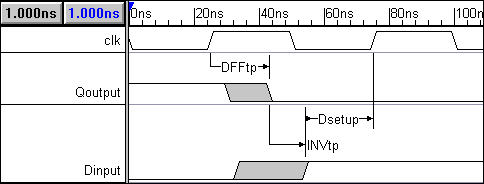
Figure 2: Completed timing diagram (captured with copy-to-clipboard function). Figure 2 is the completed timing diagram. The first thing you may notice is the gray signal transitions caused by the min/max values of the component delays. The gray areas of the signal transitions are uncertainty regions, which indicate that the signal may transition any time during that period. This is a little disconcerting especially if you have been using a low-end simulator that cannot compute both min and max at the same time. This representation shows the entire range of possible circuit performance. With WaveFormer Pro, there won't be any surprises during production when you get components at extreme ends of their tolerance range. 1) Set the Base Time UnitAt the beginning of each project, you will set the base time unit. The base time unit is the smallest representable amount of time that WaveFormer Pro can display. The base time unit determines the range of times that can be represented in your timing diagram. All time values are internally stored in terms of the base time unit. In the circuit in Fig.1, the propagation times for the gates are in units of nanoseconds and the clock has a period of 20ns. Generally it is a good idea to set the base time unit for your project one unit below the units you are working in for best rounding performance during division operations (clock frequencies are inverted and stored internally as clock periods). Therefore we will set the base time units to picoseconds. To set the base time unit:
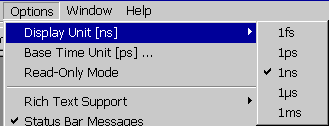
2) Set the Display Time UnitNext you need to set the display time unit. The display time unit sets the units for times which you enter and for times which are displayed. Set the display time unit to the units you most commonly use in the design. To set the display time unit:
3) Add the ClockFirst we will create the clock. The clock is named clk, has a period of 50ns (20MHz), and starts with a low segment. To add a clock:
Note: For more information on clocks, master clocks, clocks with formulas, and clock grids read Chapter 2: Clocks in the on-line help. If you made a mistake designing the clock, then double left click on the clock segment to reopen the Edit Clock Parameters dialog box. Double left clicking on a clock edge opens up the Edge Properties dialog box which displays the edge time. You may also reach the Edit Clock Parameters dialog box by double clicking on the clock name and choosing the clock properties button in the Signal Properties dialog. 4) Add SignalsNext, add two signals and name them "Qoutput" and "Dinput".
If you accidentally close the Signal Properties dialog, double click on the the signal name to open the dialog again. The Boolean Equation and Simulation features of the Signal Properties dialog are covered in the Interactive HDL Simulation tutorial. The Signal Properties dialog is modeless, so you can leave the dialog open while you perform actions on the timing diagram. 5) Drawing Signal WaveformsNext, we will draw some random waveforms to become familiar with the drawing environment.
Your drawing should be a mess, or at least look nothing like figure 2. 6) Edit signal waveformsThere are four main editing techniques used to modify existing signals (Note: these techniques will not work on clocks). The most commonly used technique is the dragging of signal transitions to adjust their location. The other three techniques all act on signal segments, the waveforms between any two consecutive signal transitions. The segment waveform can be changed, deleted, or a new segment can be inserted within another segment. Use each of the following techniques:
These techniques will not work on clocks. This is because clocks have fixed edges and segments. To edit a clock, double click on a segment of the clock waveform in the Diagram window. This causes the Edit Clock Parameters dialog box to appear. All clock parameters can be changed in this dialog box. If you cannot double click on a segment without selecting a transition, zoom in until the segment is large enough. For more information, read WaveFormer's on-line help "Chapter 1: Signals and Waveforms". 7) Adjust your diagram so it resembles the figure below
Now use the above techniques to edit the signals so they have roughly the same transitions as the signals
in the figure below. This is not the normal way to create a timing diagram, but it will teach you how
to use the editing features of WaveFormer Pro. Make sure you try all the editing techniques.
Tile the Parameter and Diagram windows so that you will be able to see the interaction between the two windows. The Report window is not used in this tutorial, so you can minimize it if your screen is small.
Adjust the zoom level of the drawing so that only 3 whole clock periods are shown on the screen.
8) Moving and Reordering SignalsAll signals are moved by dragging and dropping the signal's name. When several signals are highlighted and moved as a group, they will reorder themselves according to the order in which they are selected. This ability to quickly reorder signals by the order of selection will help you deal with the large numbers of member signals of buses. Moving a single signal:
Moving and reordering multiple signals:
9) The right mouse button (mode buttons):
In the next sections we will add delays, setups, and comments to the timing diagram. These objects are
added using the right mouse button. The function of the right mouse button is determined by the second
group of buttons on the button bar marked DELAY, HOLD, SETUP, TEXT, SAMPLE and MARKER
10) Add the D flip-flop propagation delayAdd the delay that represents the propagation time from the positive edge of the clock to the Qoutput of the D flip-flop. To add the delay do the following:
This will draw the D flip-flop delay, and creates a blank delay in the Parameter window.
When delays are added, they are blank and do not enforce any timing restraints. Notice that the delay is drawn with gray colored lines, this indicates that the delay is not forcing either the min or max edges of the Qoutput signal. Now edit the delay's parameters.
Two things happened when you pressed the TAB key:
Next, finish editing the rest of the parameter. The parameter is named "DFFtp", has a max time of 18ns, and a comment of "Ck to Q propagation time". Use the Parameter Properties dialog that is still open to add the following data:
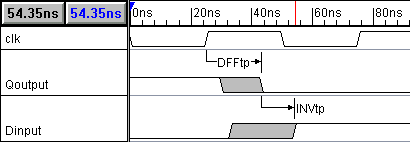
Notice that the DFFtp delay is black which indicates that it is forcing both edges of Qoutput. Also notice the falling edge of Qoutput now has a gray uncertainty region. Use the time measure readouts to verify that the edges of the region are 5ns and 18ns from the clock edge (13ns of uncertainty). Double click on the edge to see the exact edge values. The Parameter Properties dialog is modeless (other operations can be performed while the dialog is open) and interactive (any changes in the dialog fields are reflected in the diagram after you move out of that field). This tutorial has you open and close it several times so that you learn all the different ways to open the dialog. Also, the tutorial attempts to conserve screen area for laptop users. However, in a normal design you will probably want to keep this dialog open much of the time. Tip: When the Parameter Properties dialog is open you can edit a different parameter by double clicking in the Diagram or Parameter window on the parameter you want to change. If you double click in the diagram window, that instance of the parameter will be edited (the Change All Instances checkbox will NOT be checked). If you double click in the Parameter window, ALL instances of the parameter will be edited, (the Change All Instances checkbox will be checked). 11) Add the Inverter propagation delayAdd the delay that represents the propagation time of the inverter from its input Q to its output D. To add the delay do the following:
This will draw the inverter delay, and create a blank delay in the Parameter window. Now let's edit the parameters from the inside of the Diagram window instead of going to the Parameter window.
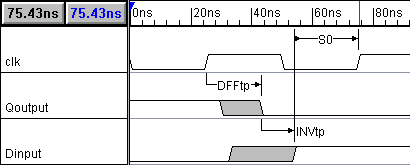
Notice the large uncertainty region for the Dinput transition. Click on the first rising edge of Dinput, then use the blue delta readout to verify that the uncertainty region lasts for 21ns (13ns from DFFtp + 8ns from INVtp = 21ns). Next, click on the first edge of clk and measure to the end of the uncertainty region of Dinput. If both the inverter and the D flip-flop are slow, Dinput may not transition until 29ns after the clock edge. 12) Add the setup for the Dinput to clockNext add the setup for Dinput to clock transition.
This will draw the setup parameter. Notice that the arrows of the setup are pointing to the control signal. This means that you added the setup correctly. Like delays, setups are also created with empty min/max values. They must have a min value before they start to monitor the data signal's position. Now we will edit the setup
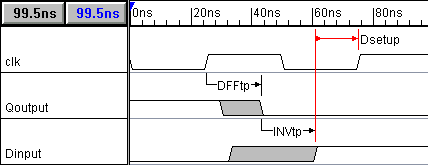
Notice that the margin column in the Parameter window says that there is a 6ns safety region before the setup is violated. Verify this by clicking on the second rising edge of the clock and placing the cursor on top of the maximum edge of the Dinput signal. The blue time readout should say -21ns (setup time 15ns - measured 21ns = -6ns margin). Next, we will demonstrate what happens when a setup is violated. Increase the inverter's delay so that the maximum delay is 18ns instead of 11ns:
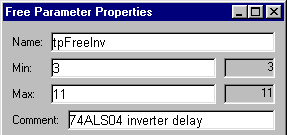
Notice that the setup has turned red in both the Diagram and Parameter windows. Change the inverter delay back to 11ns and click OK to close the dialog. 13) Add a free parameterSo far we have always directly edited a parameter's values. This is inefficient and error prone if the circuit is large. It would be better to define one variable that held the value and make everything that needed that value reference this variable. Then if the value needs to be changed, you only have to edit one variable. Free parameters act as variables that can be referenced by other parameters. They are called "free" because these parameters are not attached to any signal transitions in the Diagram window. Let's add a free parameter to hold the propagation times for the inverter. To add a free parameter:
Note: Free parameters can be saved to special library files which can later be merged into other projects. You can also reference free parameters without including them into your project file by placing libraries in your library search path (Libraries > Library Preferences menu option). For more information on free parameters and libraries read the on-line help Chapter 10: Libraries or perform the Parameter Libraries tutorial. 14) Using formulas and constantsParameters can contain mathematical formulas as well as numeric time values. Legal operations are: multiplication(*), division(/), addition(+), and subtraction(-). For example, the inverter in this circuit could represent 3 cascaded inverters used to generate a minimum delay of 9ns. To represent this in your timing diagram:
Free parameter names can also be used with an attributed parameter name such as tpFreeInv.min and tpFreeInv.max. This gives you the flexibility to specify formulas any way you need. If no attribute is added then a min or max is assumed depending on whether the formula is in the min or max column. 15) SummaryCongratulations! You have completed the Basic Drawing and Timing Analysis tutorial. In this tutorial we have covered three main topics. The first is how to start a project. Next we covered signals, which includes clocks, signals, and drawing the waveforms of the signals. And finally we covered parameters. 1) Starting a project
2) Drawing a timing diagram with Signals and Clocks
Editing waveforms
3) Timing Analysis with Parameters
|
|
|

 (DO NOT CLICK), located in the top left hand corner of the Diagram window.
 . This
status bar changes depending on the mouse location and the mode that you are in. Move the mouse around
and watch the status bar change. The status bar is very useful when you want to know what buttons do
or when you need to know what to do next in the middle of a program operation.
 to add two signals. The signals will be have default names like SIG0 and SIG1.
 or ALT-N to move to the next signal on the list. SIG1 is now displayed in the Name: edit
box.
 . These
are the State Buttons. The active button is colored
  .
.
 . (If you
have a 3 button mouse, click the middle mouse button to toggle between the two most recently activated
state buttons.)
 to activate the tristate State Button and draw another waveform segment.
 . Release the mouse button when the
green bar is at the location where you wish to place the transition.
 ). Then
left click on the State Button of the new state desired.
 , located
on the right hand corner of the button bar.


 . The red
or active mode button indicates the current functionality of the right mouse button. To activate a different
mode button, left click on it.
 .
.


 .
.

 in the Parameter Window. A blank free parameter is added to the Parameter window.